Last updated on April 22, 2026 pm
配置环境 1 2 3 conda create -n raincloud conda-forge::r-tidyverse conda-forge::r-irkernel conda-forge::r-gghalves conda-forge::r-ggbeeswarm -y"IRkernel::installspec(name='raincloud', displayname='r-raincloud')"
使用示例 1 2 3 4 5 6 7 require( ggplot2) ( gghalves) ( ggbeeswarm) ( tidyverse) ( RColorBrewer) ( repr.plot.width= 6 , repr.plot.height= 12 ) :: display.brewer.all( type = "all" )
1 2 data <- iris%>% head
1 2 3 4 5 6 7 8 p <- ggplot( data, aes( = Species, = Sepal.Length, = Species, = Species) ) <- RColorBrewer:: brewer.pal( 3 , "Dark2" ) <- p + scale_color_manual( values= rev( p_color) ) + scale_fill_manual( values= rev( p_color) )
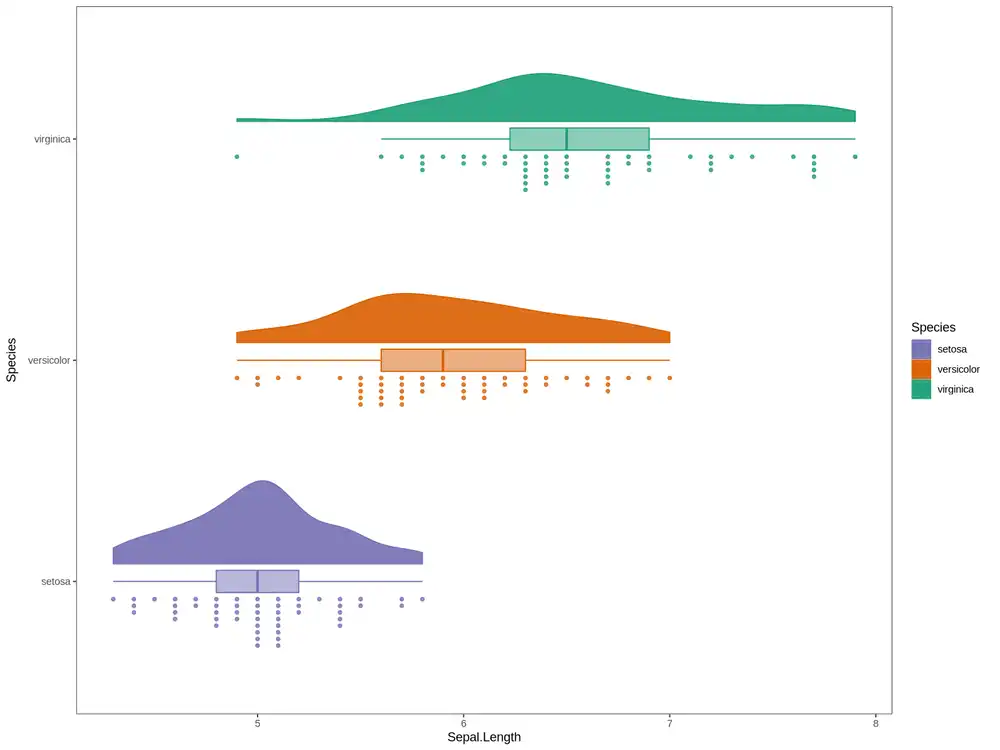
1 2 3 4 5 6 7 8 9 10 11 12 13 14 15 16 p1 <- p + geom_half_violin( = 0.08 , = 'R' , = T , = 0.9 ) + geom_beeswarm( ( x = as.numeric ( Species) - 0.08 ) , = - 1L , = 2 , shape = 20 , alpha = 0.8 ) + geom_boxplot( = NA , = 0.1 , = 0.5 ) + coord_flip( ) + theme_bw( ) + theme( panel.grid= element_blank( ) ) ( repr.plot.width= 12 , repr.plot.height= 9 )
【绘图】云雨图比较两组的分布差异
https://hexo.limour.top/distribution-differences-using-raincloud-chart